
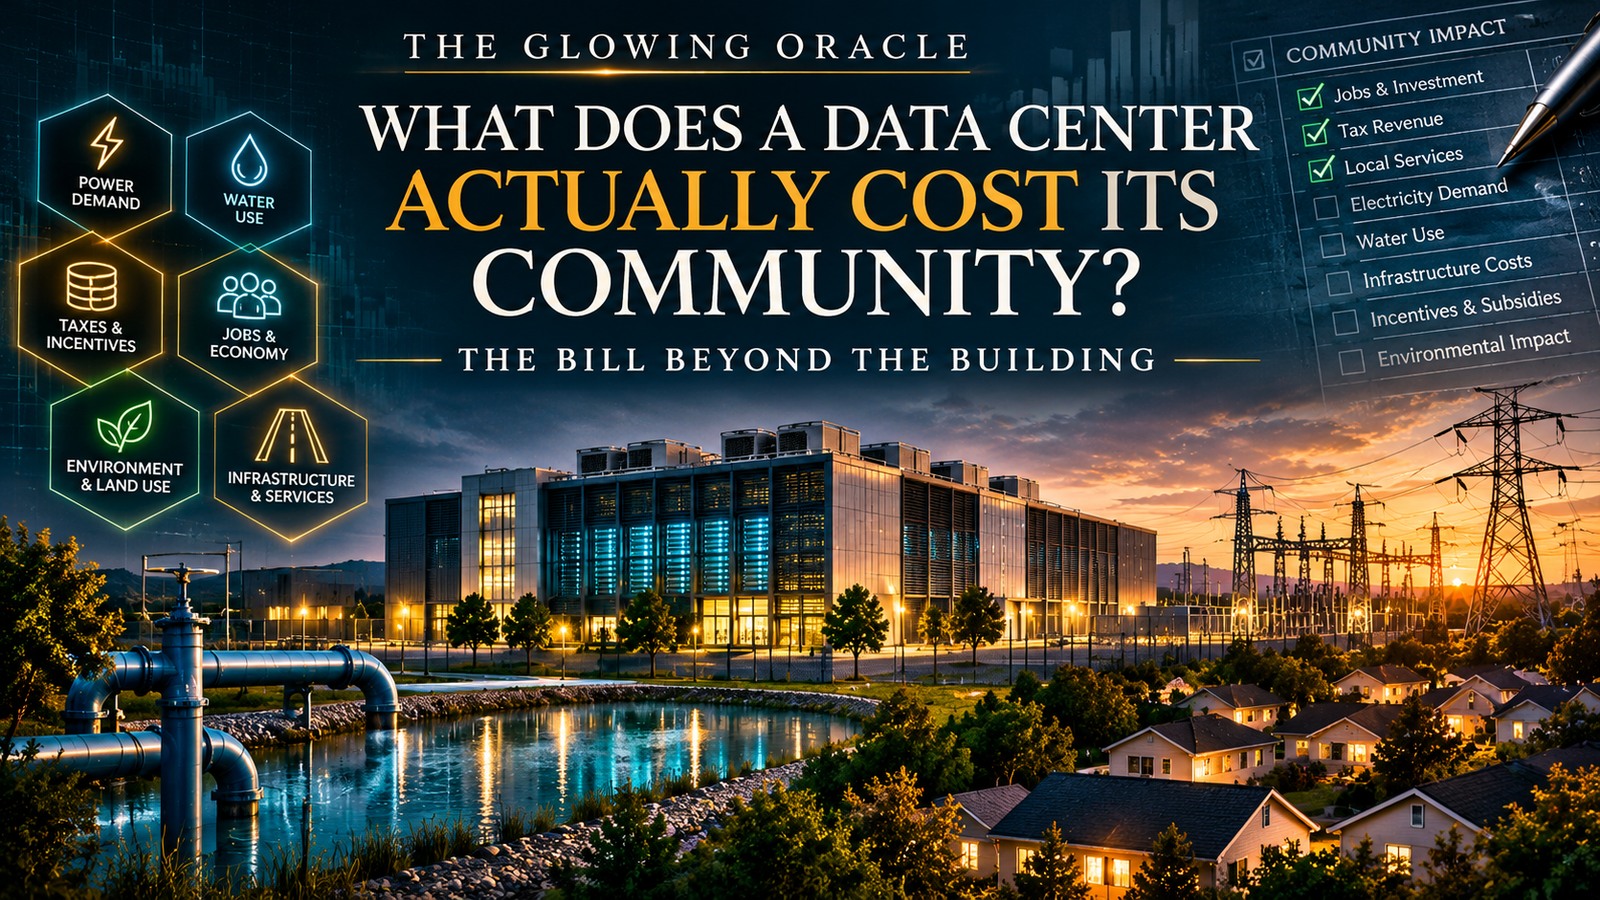
THE GLOWING ORACLE | THE SIGNAL INVESTIGATION
A new data center is rarely presented to a community as a bill. It arrives as a promise: investment, construction jobs, a larger tax base, and perhaps a place in the new AI economy. The bills are scattered elsewhere—at the electric utility, the water department, the planning commission, the tax assessor and sometimes the household meter.
That does not mean every data center is a bad deal. Some can become powerful taxpayers while drawing relatively little from municipal roads or schools. Others can accelerate expensive transmission projects, compete for constrained water supplies or require infrastructure that outlives the company that requested it. The challenge is finding out which case a town is actually being offered.
The question is not simply how much a company plans to invest. It is what the community will pay, what it will receive, who carries the risk, and for how long.
Start with the bill no one wants assigned to them
Virginia’s nonpartisan Joint Legislative Audit and Review Commission (JLARC) studied that problem in 2024. Its independent utility-cost analysis found that the rates it examined were then allocating electricity-service costs appropriately, including those incurred by data centers. That matters: claiming that every existing data center already shifts its electric bill to households would contradict the study.
But the same review warned that rapid load growth could still increase system-wide generation and transmission costs and ultimately affect other customers. It projected that a typical Dominion Energy residential customer could face an additional $14–$37 per month in generation and transmission costs by 2040, in inflation-adjusted dollars, under the modeled growth scenarios. Those are modeled future electricity-system effects—not a current charge, nor an invoice attributable to a single data center.
The distinction is fundamental. A facility might directly pay its local substation and still contribute to a larger demand forecast requiring new generation, transmission and capacity reserves. Conversely, a utility might announce a large construction program that benefits many customer groups; charging it all to data centers would be equally misleading.
Santa Clara illustrates why a community ledger needs both sides
A 2026 Santa Clara city staff report describes approximately $35.2 million in estimated contributions from data centers to the city’s 2025–26 General Fund, drawing on electric general-fund transfers, property tax and sales/use tax. The report says that is roughly 9% of General Fund resources. Those revenues support public services and are a genuine part of the benefit side of the ledger.
The same city describes more than $450 million in utility infrastructure projects already underway. That amount, however, is NOT a $450 million data-center charge. The projects support existing customers and reliability, industrial load growth, residential electrification and electric vehicles. An honest evaluation must identify the incremental cost caused by each new connection and the proportion recovered through tariffs, fees or developer financing.
Santa Clara also has a municipal electric utility and a recycled-water system. Those local characteristics may make it quite different from a proposed campus in a drought-stressed community reliant on a private power utility. Copying Santa Clara’s revenue figure to predict the budget of another town would be statistical theater.
The employment promise: thousands temporarily, dozens permanently
The Virginia study reports that construction of a typical large data-center building can take 12–18 months and involve roughly 1,500 workers during peak construction. Yet representatives described a typical 250,000-square-foot operating site as having around 50 full-time workers, about half contractors. These are illustrative industry figures, not a staffing guarantee for every site.
For communities, this changes the return-on-investment question. Temporary local wages and construction spending can be significant, but they should be separated from permanent jobs, resident hires, wages paid to contractors from elsewhere and the lasting public-service costs of operating the site.
Batavia, Illinois illustrates why local governments should label projections clearly. Its project information discusses anticipated utility income, property-tax receipts and approximately 30 permanent roles. The city explicitly cautions that actual revenue will depend on facility operations and consumption. Forecasts belong in a proposed budget, not in a column headed ‘cash already received.’
Water costs cannot be measured by gallons alone
Australia’s September 2026 AI infrastructure consultation warns that a nationally modest share of industrial water demand can still create serious local consequences. Its proposed requirements call for efficient and recycled cooling-water sources, developers paying their fair share of water servicing infrastructure, and protection against shifting costs and risks onto households or competing users. A consultation paper states a policy intention; it does not establish that every obligation is already enacted.
A water ledger needs the source and its resilience: drinking-water utility, aquifer, river, treated wastewater, or seawater. It also needs withdrawal, actual consumption, discharge quality, drought restrictions, seasonal peak demand, and the cost of pumps, pipes, wastewater treatment and water-system expansion. If reclaimed water avoids potable demand but requires a new treatment plant, the financing must be visible.
Our companion investigation, The Hidden Water Bill of AI, explains why direct cooling water and water associated with electricity generation must be measured separately. A low water-usage-effectiveness figure doesn’t automatically guarantee a responsible project in a stressed watershed.
The parts of the bargain that rarely fit a press release
- Electricity: Who pays for the dedicated connection, backup generation, transmission reinforcement, utility financing costs and any stranded assets if promised load never arrives?
- Water and wastewater: How much incremental pumping, treatment, piping and capacity is required; who pays; and what happens in a drought?
- Land and housing: What is the alternative use of the land, its prior tax contribution, the construction footprint, and possible housing or agricultural opportunity cost?
- Taxes and incentives: Which property, sales, utility and business taxes are collected; which exemptions, abatements, credits and publicly financed incentives offset them?
- Jobs and services: Distinguish construction worker-years from permanent local full-time equivalents, and account for fire, emergency response, traffic, road upkeep and inspection needs.
- Environmental effects: Noise, diesel-generator emissions, air-quality permits, water heat discharge and cumulative impacts have costs even when no convenient market price exists.
- Community benefits: Verify any district heating delivered, training placements, grid support dispatched, utility rate relief and direct community-benefit agreements as measured results rather than promises.
A repeatable community-cost scorecard
For every site, The Glowing Oracle’s investigation will keep five columns: the claimed cost or benefit, the amount and unit, the party actually paying or receiving it, the period and geographic boundary, and the original document establishing whether the number is measured, estimated, promised or disputed.
Financial community impact can be modeled as attributable recurring tax and utility benefits plus verified community payments, minus public incentives, uncompensated public-service costs, and the portion of grid and water infrastructure costs demonstrably borne by other customers. Any one-time benefit must be separated from annual values. Discounting future cash flows requires an explicit time horizon and discount rate.
But environmental and social impacts require their own ledger. Water stress, local noise, air emissions, land-use changes and reliability risk should not disappear behind a spreadsheet cell simply because they lack a reliable dollar value. An overall ‘net benefit’ headline is inappropriate while major categories remain unmeasured.
International policy provides another way to ask the question
Australia’s emerging approach is explicit: large developers should cover costs they impose on energy and water networks rather than leave communities holding the bill. In Ireland, data-center grid-connection rules impose generation/storage and renewable-electricity requirements on new applicants; these can change who bears capacity risk, but they do not yet prove how every project performs. Both approaches require monitoring of implementation, not just favorable reading of policy statements. Irish regulator’s policy decision.
A practical test for town officials
Before a development agreement is signed, ask for a public, versioned fiscal-impact statement and utility cost-of-service assessment. Require the projected connected MW and annual MWh, year-by-year local revenues, tax incentives, construction versus ongoing jobs, utility investment assignments, water balance, drought arrangements, and guarantees or collateral if expected electricity demand does not materialize.
Then request updates when the facility operates: actual demand, actual water consumption, taxes actually paid, staff actually employed and utility upgrades actually financed. A developer willing to share a credible operating record has a stronger case than one offering only a polished forecast.
The bottom line is neither reflexive opposition nor enthusiasm. Data centers can be good neighbors, bad neighbors or something in between. The outcome depends on geography, utility tariffs, water supply, tax policy, employment, environmental safeguards and enforceable contracts. A community deserves an accounting that measures each of them.
The sources behind the community ledger
- Virginia JLARC — Data Centers in Virginia, 2024, independent legislative analysis of utility costs, employment and tax benefits
- City of Santa Clara — October 2026 staff report on development, electric infrastructure and fiscal contributions
- City of Batavia — data-center project FAQ, estimated utility revenues, jobs and taxes
- Australian Government — September 2026 AI infrastructure consultation, proposed no-net-cost protections
- Commission for Regulation of Utilities — Irish data-center connection policy, December 2025
- The Glowing Oracle — Can Data Centers Help the Power Grid?
- The Glowing Oracle — Underwater, Underground or in Orbit?
Editorial method: values are not ranked or summed across different regions, cost boundaries, currencies or reporting years. Source-linked model projections are not reported as current cash costs. The community-cost database remains in private editorial review pending additional site-level filings.
Put the community bill to the test: Download the six-page “Show Us the Bill” evidence worksheet (PDF) to request data-center grid, water, tax, employment and public-service records in a consistent format. Missing evidence is recorded as unknown—not zero.
Follow This Story: See the source-linked history of AI infrastructure, electricity, cooling, water and community costs. This article contributes related reporting, not a newly verified historical milestone.
Leave a Reply